 Wael.T
 Compare Vanguard VAS and Betashares A200 by 2026 fees, index breadth, sector concentration, distributions, franking, brokerage, tax and long-term compounding.
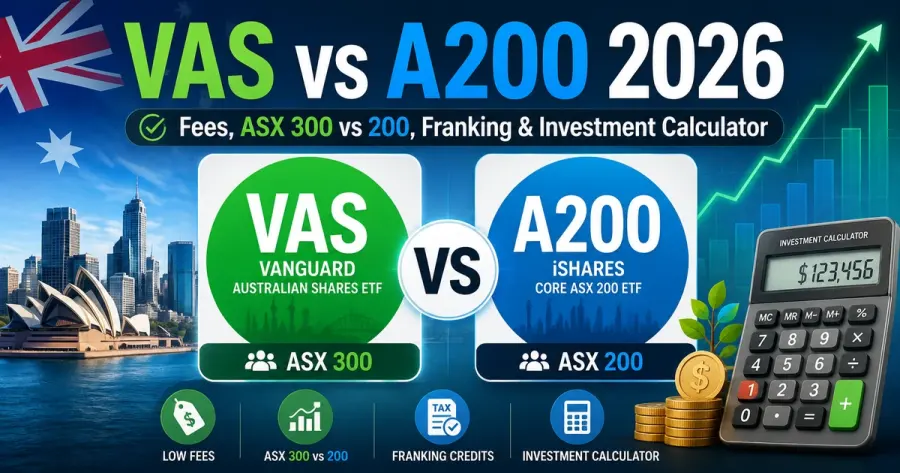
VAS and A200 are often described as interchangeable low-cost Australian-share ETFs, but they are not identical. VAS tracks the S&P/ASX 300 and charges a 0.07% management fee, while A200 tracks the Solactive Australia 200 Index and charges 0.04%. That three-basis-point fee gap is real, yet the more important differences may be index breadth, portfolio implementation, brokerage, platform choice, tax records and how much Australian equity exposure belongs in the investor’s total portfolio.
Why VAS versus A200 is a high-intent Australian investment comparison
Both ETFs are used as core Australian-equity holdings, so people comparing them are often deciding where to put recurring investment contributions for many years. Vanguard VAS is one of the largest ETFs in Australia and tracks roughly the top 300 ASX-listed companies through the S&P/ASX 300 Index. Betashares A200 tracks 200 of the largest ASX companies through the Solactive Australia 200 Index. Both use market-cap-weighted index approaches and both distribute income quarterly, but the details are not identical.
The headline cost difference is small: Vanguard currently lists a 0.07% p.a. management fee for VAS, while Betashares lists 0.04% p.a. management fee and costs for A200, with other costs potentially applying according to product documents. Three basis points sounds decisive in an internet ranking because lower fees compound positively, but on $10,000 it is only about $3 per year before compounding. The choice becomes more meaningful when combined with decades, large balances and trading costs.
First decide what role Australian shares play in the portfolio
Choosing between VAS and A200 is secondary to deciding how much of the portfolio should be invested in Australian equities at all. Moneysmart notes that Australia represents only a small portion of global investment opportunities and that investing internationally can reduce dependence on one market. An Australian investor already has salary, property and future spending linked to the domestic economy, so putting every investment dollar into Australian shares can increase home-country concentration.
Use the Investment CalculatorROI Calculator to model the full portfolio rather than treating the ETF as the entire plan. Compare a 100% Australian-equity scenario with a diversified allocation containing Australian and international equities, and perhaps defensive assets appropriate to the investor’s risk tolerance. The question “VAS or A200?” should come after “How much Australian equity do I want?”.
VAS owns more companies, but the extra 100 are small by market weight
VAS seeks to track the S&P/ASX 300, giving exposure to approximately 300 companies and listed property trusts. A200 targets 200 of the largest ASX companies. In a capitalization-weighted portfolio, however, the smallest 100 companies in VAS receive relatively small weights compared with the major banks and miners. VAS therefore has broader small- and mid-cap coverage, but the difference in overall portfolio behaviour may be less dramatic than “300 versus 200” suggests.
That additional breadth can matter over long horizons because today’s smaller companies can grow into larger constituents. It can also add exposure to businesses with different risk characteristics and lower liquidity. A200’s narrower universe is not necessarily inferior; it is simply a slightly more concentrated representation of the large Australian market. Investors should compare index methodologies rather than assume that more holdings automatically produce higher returns.
The fee difference compounds, but do the dollar math
A management-fee gap of 0.03 percentage point equals roughly $3 a year on $10,000, $30 on $100,000 and $150 on $500,000, before compounding and before any difference in tracking. Over 30 years, recurring fee savings can become meaningful because every dollar not charged remains invested. Yet an investor who pays $10 extra brokerage each month could erase the annual fee advantage on a modest portfolio.
Run two long-term calculations with the same assumed pre-fee market return and reduce one by 0.07% and the other by 0.04%. Keep the return assumption identical because neither ETF can promise future performance. This isolates the mechanical fee effect. Then add real platform and brokerage costs separately; otherwise the comparison overstates the importance of the fund management fee.
Brokerage can dominate the MER for small monthly investors
Suppose an investor contributes $500 each month and pays $5 brokerage per purchase. That is $60 per year, equal to 0.12% of a $50,000 portfolio and much more relative to a smaller balance. The difference between 0.07% and 0.04% fund fees may be only a few dollars, while transaction costs are dozens. If a platform offers zero brokerage for purchases of one provider’s ETFs but charges to buy the other, platform economics can dominate the ETF fee comparison.
Do not select a platform solely because of a promotional brokerage rate, either. Consider sell fees, transfer-out fees, spreads, recurring-investment functionality, CHESS sponsorship or custodial structure, tax reporting and the possibility that pricing changes. The ETF and the brokerage account are separate layers of cost.
Index provider differences create small but real implementation differences
VAS follows an S&P index; A200 follows a Solactive index. Each index provider has rules for eligibility, free float, market capitalization, rebalancing and constituent changes. A200’s index is designed around 200 large Australian companies and rebalances according to its methodology, while the S&P/ASX 300 includes a broader universe. Even if the largest holdings overlap substantially, reconstitution timing and smaller constituent weights can produce tracking differences.
Those differences should not be confused with active stock picking. Both products are index strategies. The investor is choosing one rules-based market representation over another. Over one year, performance may differ because of constituents, fees, cash flows and tracking; over decades, there is no basis for assuming the recent winner will remain the winner.
Sector concentration is an Australian-market issue shared by both funds
The Australian share market is concentrated in financials and materials relative to a global equity index. A200’s published portfolio in 2026 showed financials and materials as dominant sectors, and VAS similarly inherits the structure of the broad Australian market. Buying either ETF therefore gives diversification across many companies but not equal diversification across global sectors.
This is an important distinction: owning 200 or 300 companies does not remove market-level concentration. If an investor also works in banking, owns Australian property and holds large superannuation exposure to domestic shares, another Australian ETF may increase common economic risk. International equities can provide greater exposure to technology, healthcare and other industries that are less dominant locally.
Dividends and franking credits are a major part of the Australian-share experience
Both ETFs make quarterly distributions and can pass through franking credits associated with Australian company dividends, subject to the fund’s tax position and investor eligibility. Betashares publishes a distribution yield and franking level for A200; Vanguard also describes VAS as providing income including associated franking credits. The cash yield will vary and should never be treated as a guaranteed interest rate.
For an Australian taxpayer, the value of franking depends on personal tax circumstances and current law. A high grossed-up distribution yield can look attractive, but total return also includes share-price changes. Do not choose an equity ETF solely because its recent distribution yield exceeds a savings account; capital value can fall sharply even when distributions continue.
Distribution reinvestment changes record-keeping, not taxability
A200 offers a distribution reinvestment plan, and investors may have reinvestment options depending on platform and fund arrangements. Reinvesting distributions can automate compounding, but it does not generally make the distribution non-taxable. The Australian Taxation Office treats ETF distributions under managed-fund rules, and reinvested amounts can still be assessable while new units create additional cost-base records for future capital-gains calculations.
Investors using DRP for decades should keep annual tax statements and cost-base records. Convenience at purchase time does not remove the need for records when units are eventually sold. A platform with strong tax reporting can therefore have practical value even when the ETF management fee is identical.
Tracking difference matters more than the published fee alone
The management fee is visible, but an index investor ultimately receives the fund’s actual return after all implementation effects. Tracking difference is the gap between the fund and its benchmark over time. It can reflect fees, transaction costs, tax, sampling, cash balances and index-rebalancing execution. A fund with a nominally lower fee does not necessarily outperform its competitor by exactly the fee gap every year.
Review multi-year fund-versus-index reporting rather than looking only at the management fee. Do not overreact to a few basis points in one period. Both ETFs are designed to deliver broad Australian-market exposure at low cost; tracking quality should be assessed over meaningful periods.
Liquidity and spreads matter at the moment of trade
Moneysmart explains that ETFs trade on exchange and that investors should compare market price with NAV or iNAV, especially during volatile periods. A wide bid-ask spread is a transaction cost even though it does not appear in the management fee. Large, frequently traded Australian-equity ETFs generally have market-making support, but the exact spread can vary during the day.
Moneysmart suggests avoiding the opening minutes and trading when the underlying market is open. For VAS and A200, the underlying Australian shares trade during ASX hours, so normal liquid trading periods are straightforward. Long-term investors should still use sensible order practices rather than entering a large market order during a disorderly session.
Example: $20,000 starting balance and $500 per month
Suppose an investor starts with $20,000 and contributes $500 monthly for 25 years. If the market returned a hypothetical 7% before fund costs and all else were equal, the three-basis-point fee difference would create a measurable but not life-changing difference. The much bigger drivers would be the 7% assumption, contribution consistency and whether the investor stayed invested through downturns.
Use the calculator with 6%, 7% and 8% scenarios rather than one forecast. Then subtract each ETF’s current fee from the assumed return purely to illustrate cost drag. This is not a forecast of either fund; it shows sensitivity. A 1-percentage-point change in market return is vastly larger than a 0.03-point fee gap.
Example: $500,000 portfolio makes the fee gap more visible
At $500,000, a 0.03-point annual fee gap is approximately $150 in the first year before compounding. Over a decade, assuming the same market return, the cumulative difference can become meaningful. A high-balance investor may therefore place more weight on A200’s lower published management cost than a beginner with $5,000.
But high-balance investors should also consider tax realization before switching an existing holding. Selling VAS merely to save three basis points could trigger capital gains tax, brokerage and time out of market. The break-even period may be many years. New contributions can often be redirected without crystallizing existing gains.
Switching ETFs can be more expensive than keeping a slightly higher fee
Imagine an investor already owns $300,000 of VAS with a large unrealized capital gain. Moving everything into A200 to save roughly $90 of management fees in the first year could create thousands of dollars of tax. Even if the lower fee is attractive for new money, selling an established position may be economically irrational.
Use a break-even framework: estimate tax and transaction cost caused by the switch, then divide by expected annual fee savings. If the break-even period is extremely long, keeping the existing ETF and directing future contributions differently may be more efficient. Tax consequences are personal, so obtain professional advice where material.
Superannuation exposure should be included in the home-bias calculation
Many Australians already own Australian shares through super. Someone comparing VAS and A200 in a taxable brokerage account may unknowingly duplicate a large domestic allocation inside superannuation. Look through both portfolios before deciding the desired Australian-equity percentage.
If super already holds a large Australian indexed option, personal investing might be used to add international equities or another asset class rather than more domestic exposure. Asset allocation across all accounts matters more than optimizing one ETF in isolation.
Tax timing can make ETF ownership feel less simple than the product itself
ETFs are operationally simple to buy, but Australian tax reporting can include franked income, capital gains distributed by the trust, foreign income in other ETFs and cost-base adjustments. The annual tax statement is therefore important. A cash distribution is not always identical to the assessable amount shown on the tax statement.
Keep records even if the broker pre-fills data. If units are transferred between platforms, preserve historical purchase and DRP information. Product simplicity should not be mistaken for zero administration.
Past performance should not decide between two index funds
Betashares and Vanguard both publish historical returns, and both warn that past performance does not predict future performance. Because VAS and A200 track different indices, one can outperform the other in a period due to constituents or index rules. Chasing the recent winner defeats the purpose of a long-term passive strategy.
Compare objective, index, cost, implementation and suitability. If either ETF provides the exposure you want at low cost, disciplined contributions and staying invested can be more important than repeatedly switching based on trailing returns.
Which investor may prefer VAS?
VAS may appeal to investors who want a broader slice of the Australian listed market, prefer the S&P/ASX 300 benchmark, already use Vanguard’s ecosystem or value its long operating history and scale. The additional smaller companies modestly broaden exposure beyond the top 200.
That preference should not be turned into a claim that 300 stocks will outperform 200. The additional breadth changes exposure; it does not guarantee a higher return. Platform costs and total portfolio construction still matter.
Which investor may prefer A200?
A200 may appeal to investors who want a very low published management cost and are comfortable with a top-200 Australian index. Its 0.04% fee is exceptionally low for Australian-equity exposure, and the fund has grown to substantial scale. For a high balance accumulated over decades, even small fee reductions are valuable.
Again, the lower fee does not guarantee a better realized outcome every year. Tracking, tax, brokerage, spreads and behaviour all contribute to investor return. The decision is strongest when A200’s index exposure is already what the investor wants.
What to verify before investing
Read the current PDS and Target Market Determination, check management fees and costs, index methodology, distribution policy, DRP, brokerage, ownership structure, spreads and tax reporting. Confirm that the investment timeframe matches equity risk: Vanguard currently labels VAS high to very high risk with a suggested horizon of seven years or more, and Moneysmart emphasizes that ETF values can fall.
Never use money needed soon for a house deposit or emergency fund simply because an equity ETF has attractive long-term historical returns. Shares can be down when the money is needed. Match the asset to the goal before choosing the ticker.
Bottom line: A200 is cheaper, VAS is broader, but allocation and behaviour matter more
In 2026, A200 has the lower published management cost at 0.04% versus VAS at 0.07%, while VAS tracks about 300 Australian companies rather than 200. That creates a genuine low-cost-versus-breadth trade-off, but the magnitude is modest compared with market risk, home-country concentration, tax and contribution discipline.
Use the investment calculator below to test fees over decades with identical return assumptions, then examine the ETF inside your whole portfolio. This article is general education, not personal investment or tax advice, and future returns, distributions and fees are not guaranteed.
Compare long-term compounding for VAS and A200 with the Investment Calculator